Services

Business Intelligence BI

Business Intelligence - What is it?

We understand Business Intelligence (BI) very broadly as a set of tools supporting the use of knowledge hidden in the data that every company or organization collects or acquires.

From the simplest applications, such as business alerts or when calculating typical or slightly more complex KPIs, to extracting non-obvious conclusions from the analysis of summaries of seemingly unrelated information.

We especially value solutions operating in real time, but most often based on data warehouses for efficiency reasons.

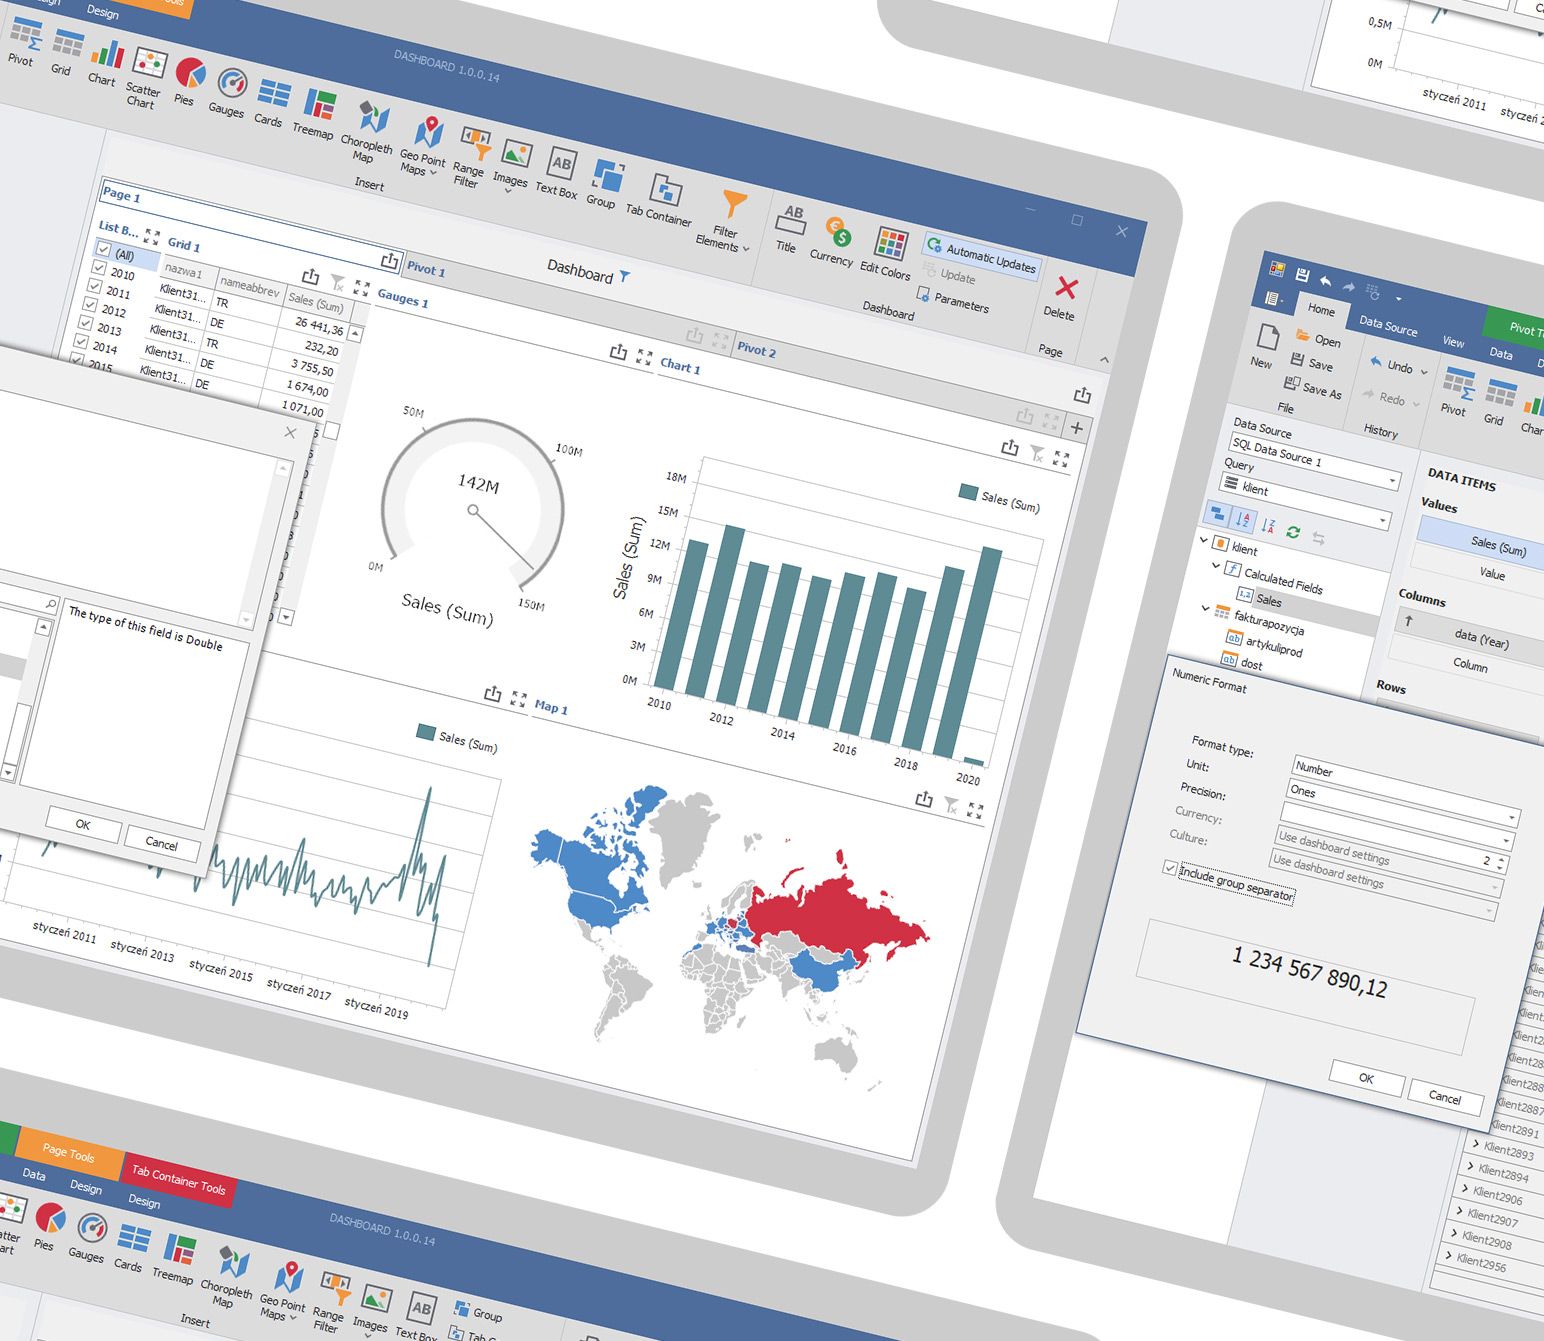
In order to speed up and facilitate access to information, we most often use dashboards that visualize the results in a way that is easy to read and allows for a quick response. Of course, we also use automated reporting and notification processes.

Interactive dashboards allow you to obtain different sections from the same data sets - observing an interesting tendency, we can very quickly come to an explanation of its cause. In addition, interactivity - most often the possibility of applying filters to data - allows an analyst or IT department to prepare a universal tool for a manager that will satisfy most of his needs in obtaining reports and make him independent in this process.

BI tools can also help business organizations to automate the processes of consolidation or closing sales or production periods. Also for budgeted plans.

Why do I need Business Intelligence?

Let's start with a few real-life examples:


Taking sledgehammer to crack a nut?

Do you have a proven warehouse and sales system that does not have an extensive reporting system and you do not want to give it up? They persuade you to costly migrate to a new ERP solution? Or maybe your system may have a report module, but its implementation exceeds your budget? There is an alternative. Leave the warehouse and sales department their favorite software, which they use with their eyes closed, and you can "connect" to your data with our managerial panel.


A company with branches in countries with different currencies.

How to constantly aggregate and monitor results in a multi-currency organization? In one of our implementations we proposed a data warehouse, supplied daily with data from branches with transaction prices normalized to one currency according to average rates on the day of operation. Thanks to this, the prepared dashboard allows for the analysis of consolidated operations in any cross-sections, allowing for comparison and analysis of trends.


Your sales dropped in January and you don't know why …

Perhaps if you followed the book-to-bill ratio (the relation of new orders to issued invoices in the same period), you would have noticed the problem ahead of time and had time to react accordingly. And January was supposed to be so beautiful ...


Visit to the supplier. Highrunners.

Are you waiting for an interview with the supplier? It is worth showing yourself to him as a client aware of his worth. Nothing is as impressive as professional charts and statements. Or maybe it's worth to talk about highrunners and fight for prices? Sometimes a slight reduction in sales triggers a disproportionate increase in sales. Or was it already so? There is no guesswork, there are arguments (charts).


Plans, plans …

You plan, budget, but do you verify ..? Imagine a large monitor in the Sales Room showing live budgets of daily, monthly, quarterly ... Will there be a bonus this month?

lsb bulb

Are you ready to start?

How can we help?

Our BI applications can be custom made solutions that we will integrate into your IT work environment. They can also be universal tools that you can supply with data yourself and build advanced, interactive management desktops yourself. The latter are recommended for small and medium-sized organizations. Thanks to such solutions, it is possible to successfully implement a modern reporting system in the company in literally a few days, and sometimes even hours.

How to start?

A typical process of implementing simple BI can be divided into stages:

  • recognizing the user's needs
  • identification of resources (of the available data)
  • depending on the complexity of resources and needs:
    • preparation of an intermediate database (warehouse) aggregating data from various sources or defining data to be retrieved from the production base if the requirements and resources are not too complex
    • designing a management dashboard to present the expected indicators and interactive pivot tables with charts. The mechanisms of "extracting" data are very easy to learn, having at your disposal a graphical constructor (Query Builder and Dashboard Designer), with the help of which you literally click on a really impressive end result
    • for alert applications, cooperation with IT is already necessary - you need to prepare cyclically run scripts or programs that will process the data appropriately and aggregate it in a specific way (send an email, text message or other type of notification specified by the user).
    • After some time, it is worth verifying the fit of indicators, tables and charts. To improve, change, add new …


In simple applications, using appropriate tools, we can very quickly and independently implement BI in your organization. We encourage you to visit our special website - sos-db.com - dedicated to a universal, budget BI solution - SOSDashboard, ideal for starting an independent adventure with Business Intelligence.

lsb bulb

Request a demo

Business Intelligence BI case studies

Have an idea? Let's talk about your project.